Rising non-brand CPCs are structurally increasing acquisition costs, forcing enterprises to rely on increasingly expensive, cold demand to sustain growth. The solution is to model acquisition as a system, proving that brand awareness directly improves search efficiency by increasing click through rates (CTR), conversion rates, and lowering blended customer acquisition costs (CAC).
Executive teams that operationalize this relationship can use brand investment as a financial lever to offset search cost inflation and stabilize long-term growth.
The Core Challenge: The Margin Squeeze of Rising Non-Brand CPCs
Rising non-brand CPCs are steadily increasing acquisition costs, even as paid search continues to appear efficient on the surface. As brand investment declines, growth shifts toward colder, more competitive traffic, creating a dependency loop that drives costs up and compresses margins.
For most CMOs, Paid Search is the ‘ATM,’ the first place they look for immediate, attributable revenue. It’s where budgets go when leadership needs immediate revenue impact. And on the surface, that logic makes sense: search captures demand that already exists.
But that assumption starts to break down under one condition that’s easy to overlook: what happens when the cost of capturing that demand keeps rising?
That’s exactly what many advertisers are experiencing right now. Recent benchmark data shows that cost per click has increased in 86% of industries, with an average rise of 10% year-over-year. This isn’t a one-off spike; it’s a structural trend.
And it doesn’t usually hit all at once. It shows up gradually:
- Auction density is peaking; you’re no longer just bidding against direct rivals, but against every aggregator with a venture-backed burn rate.
- Google’s ‘Black Box’ automation (Performance Max and Smart Bidding) pushing everyone into the same high-intent auctions, commoditizing the bid.
- Less room to differentiate on generic, non-brand terms
Inside a Google Ads account, this rarely looks dramatic. It shows up in small, compounding signals:
- Cost per click inching up month over month
- Conversion rates slowly declining on non-brand campaigns
- Watching your Target Cost Per Acquisition (tCPA) targets drift right to protect Absolute Top of Page (ATOP) share while your conversion volume remains flat
- Impression share declining unless bids increase
But the real signal shows up in the platform details.
In Auction Insights, you’ll often see new competitors that aren’t direct peers: large marketplaces, aggregators, or retailers entering your core non-brand auctions. These players can afford to overbid because they monetize differently, which raises the clearing price for everyone else.
At the same time, keyword control is eroding. “Exact Match” now includes close variants that pull in broader, higher-funnel queries. In the Search Terms Report, this shows up as:
- budget bleed from ‘Close Variant’ matches that treat your specific negative keyword list like a polite suggestion rather than a hard boundary.
- limited visibility due to hidden low-volume queries
- negative keyword management becoming reactive
The result is subtle but critical: you’re paying more for less qualified traffic.
From a platform perspective, nothing appears broken. Campaigns still deliver conversions. Budgets still pace.
But structurally, the auction has changed and financially, something is eroding.
The Hidden Problem: Buying Colder Traffic
When brand awareness is low or declining, the only way to scale acquisition is to:
- target broader, less qualified queries
- increase bids to stay competitive
- expand into colder audiences
That creates a dependency loop:
Brand investment is reduced → search takes on growth → search is forced to acquire colder users → costs rise → margins compress
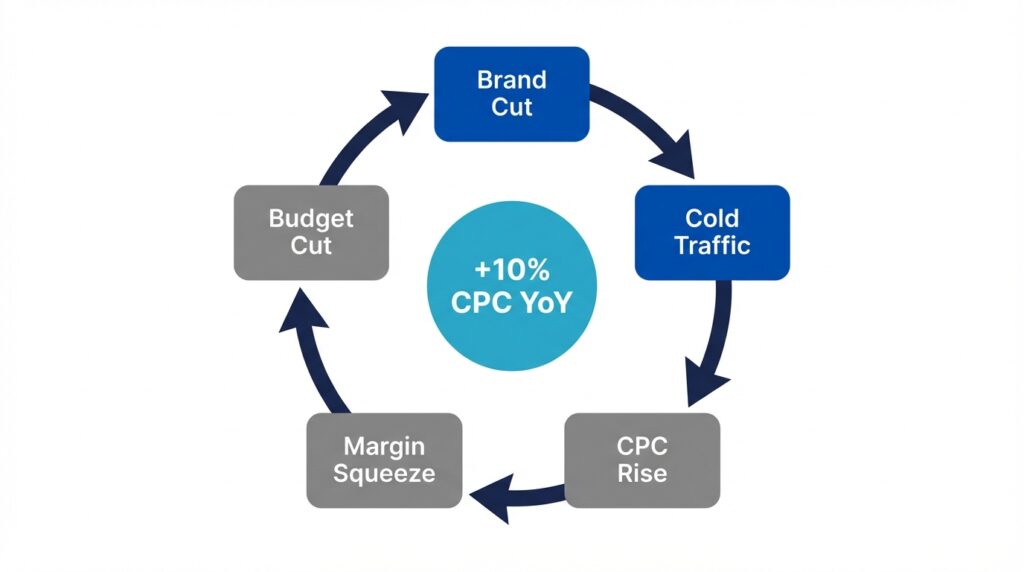
The risk isn’t just rising costs per click (CPCs). It’s misdiagnosing the cause.
Most teams respond by optimizing inside the auction:
- refining keywords
- adjusting bids
- testing ad copy
Those changes help, but they don’t solve the problem.
This is the quarterly review everyone has sat through. Search looks flat. Someone proposes expanding match types or launching a new campaign structure. The room debates landing pages and ad copy. Meanwhile, brand search volume has been declining for three months straight — but that metric lives in a different dashboard, owned by a different team, and it never gets surfaced. The diagnostic framework itself is broken. Teams are troubleshooting inside the auction when the real deterioration is happening outside of it.
Because the issue isn’t in the auction.
It’s outside of it.
You’re asking Google Ads to do the job of brand marketing.
And Google will do it, but at a premium.
The Strategic Shift: Correlating Reach with Search Efficiency
Brand investment improves acquisition efficiency by increasing how often users click and convert in search. When reach expands, more users recognize the brand, leading to higher CTR, stronger conversion rates, and lower overall customer acquisition costs.
The solution is to stop measuring brand and performance in isolation and instead model how upper-funnel reach directly improves lower-funnel efficiency. This requires shifting from channel-level reporting to system-level economics.
To solve the margin squeeze, organizations need to rethink the question entirely.
It’s not: what is the ROI of brand?
It’s: what happens to our acquisition costs when more people know who we are?
Because brand doesn’t operate as a standalone channel; it changes how every downstream interaction performs.
Large-scale research across 575 brands and $264 billion in ad spend reinforces this: national traditional advertising increases perceived quality, value, and customer satisfaction. And those perception shifts show up later, in the moments that actually drive efficiency: higher click-through rates, stronger conversion rates, and ultimately lower acquisition costs.
That’s the missing link most teams never model.
Once you connect reach to search performance, the problem becomes solvable only if you operationalize it correctly.
That’s where most organizations get stuck.
Turning this insight into a repeatable system requires three distinct shifts:
- how you measure acquisition
- how you connect data across channels
- and how you communicate the strategy at the executive level
You can break that down into three pillars:
Pillar 1 – Shifting from Direct Response to Blended Customer Acquisition Cost (CAC) Tracking
Blended CAC measures the true cost of growth by combining total sales and marketing spend with actual new customers or revenue. By aligning fully loaded costs with time-adjusted outcomes, organizations can track acquisition efficiency as a system, not just by channel.
Blended CAC is where this shift becomes real but more importantly, it’s where marketing measurement starts to look more like finance.
Most teams overcomplicate this. In reality, you can stand up a working version quickly if you focus on the right inputs and define them clearly.
At its core, blended CAC comes down to two numbers:
- Total sales and marketing investment
- Total new customer value generated
But the nuance and the credibility come from how you define those inputs.
Step 1: Pull fully loaded spend (not just media)
Start by aggregating your total sales and marketing costs for a given period.
Be careful not to undercount. Instead of just pulling media spend from platforms like Google Ads or Meta, include:
- Media spend (Search, YouTube, Paid Social, Display)
- Agency fees
- Internal marketing salaries (if material)
- Sales costs tied to acquisition (including commissions, if applicable)
This aligns more closely with how finance evaluates acquisition efficiency. Fully loaded sales and marketing expenses, not just ad spend, is the true input to CAC efficiency.
Step 2: Pull new customer output (from your source of truth)
Next, pull your net-new customers or revenue from your Customer Relationship Management (CRM) or billing system, not from ad platforms.
Depending on your business model, this could be:
- First-time purchasers (eCommerce)
- New customers (B2B)
- New annual recurring revenue (ARR) or contracted revenue (SaaS)
The key is consistency: this number should reflect actual business outcomes, not attributed conversions.
Step 3: Align timing (this is where most teams get it wrong)
Blended CAC is not always a same-period calculation.
In most businesses, there’s a delay between when you spend money and when a customer converts. If you ignore that timing, CAC becomes volatile, driven by reporting windows, not actual performance.
The key is to measure that delay directly.
In Google Ads, this shows up in the Days to Conversion or Path Metrics reports (Tools → Measurement → Attribution). These reports show how long it typically takes a user to convert after their first interaction.
In many accounts, that lag is not trivial. It can be 7, 14, or even 30+ days depending on the buying cycle.
If your data shows a 14-day lag, a same-week or even next-week CAC calculation is misaligned by definition.
So instead of forcing spend and outcomes into the same window, you align them based on observed behavior:
- Short cycle → this month’s spend vs. next month’s customers
- Longer cycle → prior period’s spend vs. current outcomes
The goal is simple: match the investment to the result it actually drove.
The defaults work against you here. The Days to Conversion report exists inside Google Ads (Tools → Measurement → Attribution), but it isn’t reflected in any default campaign view, and no automated bidding strategy accounts for it when reporting back to you. The structural incentive isn’t that platforms hide the data — it’s that real-time dashboards are more engaging than lagged ones, so that’s what gets built and that’s what gets looked at. The result is the same: teams optimize against a reporting window that doesn’t match how their business actually converts.
For example:
- A user clicks in January
- Converts in February
Google Ads reports that conversion in January: January spend → January conversions
But your business experienced: January spend → February customers
That mismatch distorts CAC, pairing spend with conversions that haven’t happened yet or pulling in ones from future periods.
There’s a second-order effect most teams miss.
In many attribution models (Linear or Data-Driven), upper-funnel channels like brand or YouTube often act as early touchpoints. When those channels are reduced, conversion paths don’t disappear immediately; they degrade over time.
So when brand investment is cut, search performance doesn’t collapse today. It weakens weeks later, once those earlier touchpoints are no longer feeding the funnel.
To fix this, you shift the window: January spend → February customers
Now cause and effect are aligned.
And once they are, CAC stabilizes, becoming something you can actually compare, trust, and manage.
Step 4: Calculate blended CAC (or CAC ratio)
There are two primary ways to structure blended CAC:
1. Blended CAC (unit-based): Time-aligned total spend ÷ time-aligned new customers
This answers a straightforward question: what did it cost us to acquire a customer?
It’s most useful when customer value is relatively consistent and teams are focused on cost control and cost per acquisition (CPA) efficiency. For many organizations, this is the clearest starting point and often enough to surface major inefficiencies.
2. Blended CAC Ratio (revenue-based): Time-aligned total spend ÷ time-aligned new revenue
This shifts the lens into how efficiently you’re turning marketing dollars into revenue.
It becomes more valuable when customer value varies, sales cycles are longer, or finance is evaluating growth through the lens of capital efficiency. As a result, this version is more commonly used in executive and board-level discussions.
The key is not which one you choose but that you choose one and apply it consistently.
Step 5: Track it consistently (this is where the insight compounds)
At this point, the goal isn’t precision, it’s consistency.
You’re not trying to calculate a perfect CAC. You’re building a reliable trend line you can make decisions against.
That means:
- Tracking it on a consistent cadence (weekly or monthly)
- Using the same definitions every time
- Applying the same timing logic
Because once those variables are stable, something important happens:
The number starts to mean something.
You can see how acquisition efficiency is actually changing, not just within a channel, but across the entire system.
- When blended CAC improves, something in your mix is working
- When it rises, something is introducing inefficiency
- When you shift budget (e.g., into brand or reach), you can see the downstream impact
This is where you stop being an ‘Order Taker’ for the finance team and start being a ‘Growth Architect.’
Instead of reacting to isolated CPA changes inside Google Ads, you’re managing a single metric that reflects how your entire acquisition strategy is performing.
Once this is in place, you gain something most teams don’t have: a financially grounded view of acquisition.
Blended CAC reframes acquisition from a channel optimization problem into a capital allocation decision, aligning marketing performance with financial outcomes.
But seeing the system is only the first step.
The next challenge is understanding what’s actually driving those changes, and that requires connecting performance across channels.
Pillar 2 – Building Cross-Channel Data Correlation Models
Cross-channel correlation models show how brand reach improves downstream search performance over time. By aligning brand exposure with later changes in CTR, conversion rate, and CPA, organizations can identify how awareness drives more efficient customer acquisition.
Blended CAC tells you that efficiency changed. This pillar explains why.
To get there, you need to shift how you measure performance.
You are not measuring attribution, you are measuring sequence. When reach increases, does search become easier to convert afterward?
If the answer is consistently yes, you’ve identified the relationship.
At a practical level, that means comparing:
- Brand inputs (reach and spend)
- Search outputs (CTR, conversion rate, CPA)
From there, you can build a working version of this model with a simple weekly dataset.
Start with a single table:
Step 1: Capture brand reach (top of funnel)
From YouTube, Meta, display:
- Spend
- Impressions / reach
- Video views (if relevant)
Step 2: Capture search efficiency (bottom of funnel)
From Google Ads:
- Filter to non-brand campaigns only
- Pull:
- CTR
- Conversion rate
- CPA
- (Optionally) impression share
Now you have two layers:
- What changed in awareness
- What changed in performance
Step 3: Introduce Time (This is how you reveal cause and effect)
Most teams compare spend and performance in the same week. But that’s not how people buy.
They see your brand → wait → search later → then convert
For example, take this raw data:
| Week | Brand Spend | Non-Brand CTR |
| Week 1 | $50K | 2.6% |
| Week 2 | $50K | 2.5% |
| Week 3 | $20K | 3.0% |
| Week 4 | $20K | 3.1% |
| Week 5 | $20K | 2.9% |
| Week 6 | $20K | 2.8% |
At first glance, this looks backwards: Spend drops → CTR goes up
But the issue isn’t performance, it’s timing.
You’re comparing spend and behavior in the same week, even though the impact of brand shows up later.
To correct for that, align each week’s search performance with prior brand exposure, typically with a 2–6 week lag:
| Week | Brand Spend (This Week) | Brand Spend (2 Weeks Earlier) | Non-Brand CTR |
| Week 1 | $50K | — | 2.6% |
| Week 2 | $50K | — | 2.5% |
| Week 3 | $20K | $50K (Week 1) | 3.0% |
| Week 4 | $20K | $50K (Week 2) | 3.1% |
| Week 5 | $20K | $20K (Week 3) | 2.9% |
| Week 6 | $20K | $20K (Week 4) | 2.8% |
Now the pattern becomes clear:
- Higher spend (Weeks 1–2) → higher CTR (Weeks 3–4)
- Lower spend (Weeks 3–4) → declining CTR (Weeks 5–6)
Step 4: Identify and Interpret Directional Patterns
You are not looking for perfect correlation, you are looking for repeatable patterns, and understanding what those patterns actually mean.
Start by asking:
- Do increases in reach precede higher CTR?
- Do conversion rates improve after sustained brand investment?
- Does CPA stabilize or improve without major bid changes?
If those patterns repeat, you’ve found the signal. But it’s important to understand what that signal represents.
In practice, teams validate this using a few concrete signals inside the account.
The first ‘canary in the coal mine’ is your Brand Impression volume. In Google Ads, this shows up in your Brand campaigns. If upper-funnel investment is working, brand impressions and query volume should increase within a reasonable lag window. If spend rises and brand search doesn’t move, awareness isn’t translating into demand.
The second is non-brand CTR, where the “halo effect” becomes visible. When users recognize your brand, they’re more likely to click it in a competitive search engine results page, even on generic queries.
That’s the early signal.
In most cases, the impact then shows up in stages:
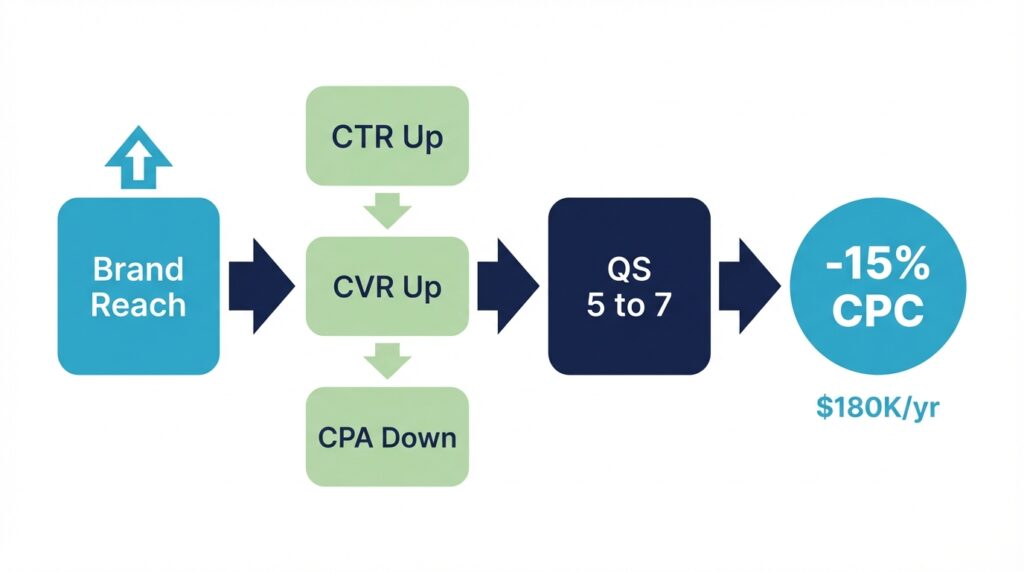
- CTR improves first: more users recognize and choose your brand
- Conversion rates follow: users arrive with more trust and context
- CPA stabilizes or improves: performance strengthens without bid changes
That sequence is how brand influence manifests in search performance.
And importantly, those are not just surface-level improvements. They directly affect how efficiently you compete in the auction.
Click-through rate feeds into Quality Score, which determines your cost to compete. Advertisers with high Quality Scores (10/10) can see up to a 50% reduction in cost per click, while low scores can increase CPC by 150% or more.
To make that concrete: if brand investment lifts non-brand CTR from 2.5% to 3.5% over a quarter, and that improvement moves Quality Score from 5 to 7, the CPC discount compounds across every click in the account. On $100K/month in non-brand spend, even a 15% CPC reduction is $15K/month — $180K/year — that the CFO can see in the P&L. That’s the number that turns a brand conversation into a finance conversation.
So when you observe sustained improvements in CTR and conversion rate, you’re not just seeing better engagement, you’re seeing the inputs that lower acquisition costs over time.
CPC, however, may not drop immediately.
In many accounts, Google reinvests those efficiency gains into more volume first, not cheaper clicks. So instead of seeing lower CPC right away, you may see:
- more conversions at similar spend
- higher impression share
- stronger output without increasing bids
The cost benefits show up later, after that additional demand has been captured.
Step 5: Compare Channels Without Over-Attributing
Once you can see the relationship between reach and search efficiency, the next step is understanding which inputs are contributing.
Instead of aggregating all brand spend together, break it out by channel and apply the same lag logic:
| Week | YouTube (2w prior) | Paid Social (2w prior) | Display (2w prior) | Non-Brand CTR |
| Week 1 | — | — | — | 2.6% |
| Week 2 | — | — | — | 2.5% |
| Week 3 | $30K | $15K | $5K | 3.0% |
| Week 4 | $30K | $15K | $5K | 3.1% |
| Week 5 | $10K | $5K | $5K | 2.9% |
| Week 6 | $10K | $5K | $5K | 2.8% |
Now the pattern becomes clearer:
- Higher YouTube and social spend (Weeks 1–2) precedes stronger CTR (Weeks 3–4)
- Reduced spend (Weeks 3–4) is followed by declining CTR (Weeks 5–6)
- Display remains stable, indicating it’s likely not driving the shift
Teams should look for consistency across multiple cycles rather than reacting to a single period of improvement. One-off changes can be driven by seasonality, promotions, or competitive shifts, but repeatable patterns are what validate the model.
You’re not trying to isolate a single “winning” channel.
You’re identifying which inputs consistently precede improvements in search performance and where incremental investment is most likely to improve efficiency.
Over time, those gains show up as lower costs. But the signal appears earlier in how easily you convert demand, not just what you pay for it. This is how brand investment decisions move from intuition to evidence.
Pillar 3 – Presenting the Brand Defense Strategy to the Board
Brand investment should be evaluated as a financial lever that reduces acquisition costs, not as an awareness initiative. By improving how users engage and convert, brand lowers reliance on expensive non-brand search and makes growth more efficient and predictable.
Once you can show that brand investment improves search efficiency and lowers blended CAC, the final step is turning that insight into a financial decision.
This is where most organizations get stuck.
They have the data. They can see performance improve when brand investment increases. But they present it the wrong way, so it gets treated as optional.
At the board level, the question is not whether brand drives awareness but whether it protects the cost of acquiring the next customer.
Brand is still framed as “something we do to build awareness.” And that framing fails because awareness doesn’t compete with rising costs.
The reality is simpler and more important.
Brand is not an awareness initiative. It is a mechanism for controlling acquisition costs.
More specifically, it acts as an insurance policy against CPC inflation.
The math is straightforward. With non-brand CPCs rising at 10% year-over-year across most industries, a $10 non-brand CPC today becomes roughly $16 within five years at that rate. If your acquisition strategy relies entirely on non-brand demand, your cost structure rises with it and there’s no lever to pull.
But if brand investment increases brand search demand, where clicks may cost a fraction of non-brand terms, you introduce a lower-cost source of acquisition into the system.
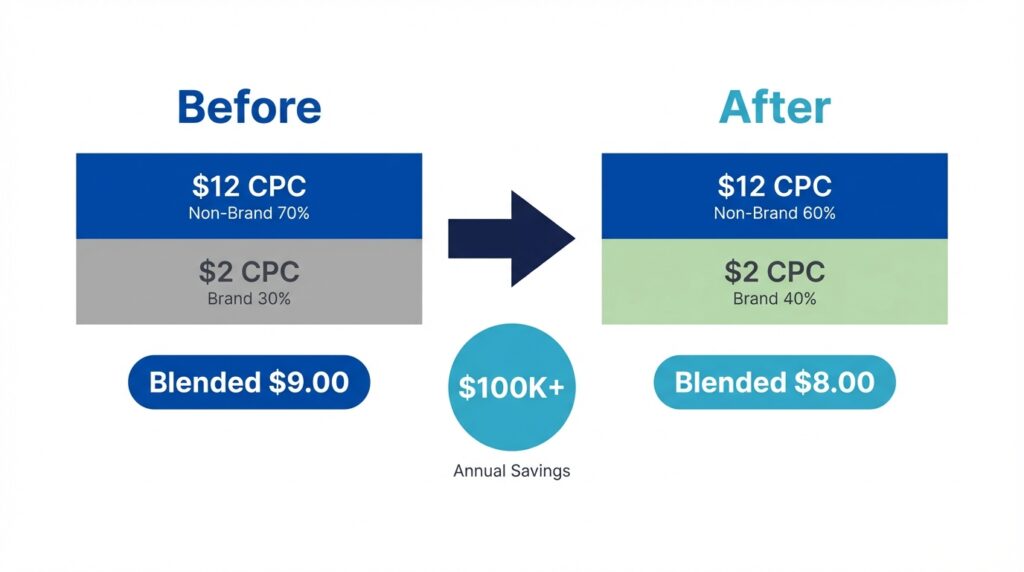
Here’s where it becomes a board-level number. If brand search volume is 30% of total clicks at $2 CPC and non-brand is 70% at $12 CPC, your blended CPC is $9.00. If brand volume grows to 40% through sustained awareness investment, blended CPC drops to $8.00 — without touching a single bid. On $1M in annual search spend, that’s over $100K in savings from mix shift alone.
This is effectively auction arbitrage: using brand equity to capture demand at a lower cost while competitors overpay for generic terms.
Once you frame it this way, the conversation changes.
You’re no longer asking for budget to “build the brand.” You’re showing that without brand investment, more of your growth has to come from non-brand search where every click is contested, prices are rising, and efficiency declines over time.
From there, the implication is hard to ignore:
- If brand is underfunded, acquisition becomes more expensive and less predictable
- If brand is sustained, you maintain access to lower-cost demand and stabilize acquisition efficiency
That’s not a marketing insight. It’s a financial one.
And it changes how growth decisions get made.